Monitoring Corda Nodes using Prometheus and Grafana
July 01, 2020
Deep dive on Corda node monitoring with Prometheus and Grafana
Monitoring is an important part of any enterprise application. It helps provide great insights into what’s happening behind the scene in your application and gives an idea of the overall health of the application.
Corda is a complex system with multiple moving parts, so it is utterly important to monitor Corda nodes to ensure that they are behaving as expected. To help with that, Corda nodes can be configured to export various metrics using the JMX infrastructure.
Continuing on Neal’s awesome blog, on setting up monitoring on Corda with Prometheus, Grafana, and elk stack, let’s go a little deeper from the perspective of setting up a Grafana dashboard for monitoring different metrics for a single Corda node.
New to Corda? A great way to start with Corda is to take a look at one of our online bootcamp webinars. The recording for one of them is available here: https://www.youtube.com/watch?v=tVE1rKbFA3g
You may also consider joining us for one of our in-person or live virtual bootcamps. Keep an eye on the link below to know what events are coming up: https://corda.net/blockchain-bootcamp/
You may also want to take a look at the free official Corda training available here: https://training.https://corda.net/
Getting ready with the setup
First thing first, we need to do some setup and use the right tools for monitoring. In this post, we are going to use Prometheus to read the node metrics and Grafana for visualization. We will set up everything (Corda, Prometheus, and Grafana) using Docker and Docker-Compose.
I explained how to setup Corda on Docker in my previous post: https://corda.net/blog/containerizing-corda-with-corda-docker-image-and-docker-compose/.
I would refer you to Neal’s blog for detailed setup instructions. However, I am just going to suggest a few changes to the setup since Neal’s blog looks at monitoring from an entire Corda network perspective, while in this blog we are focusing on monitoring a single node.
Corda Enterprise Node Setup
The setup instruction in Neal’s blog uses the Corda Open Source node. If you want to setup Corda enterprise node for monitoring you could:
- Update the Corda Open Source Docker image to Corda Enterprise Docker image in the generated docker-compose.yml file. Corda Enterprise Docker Image (4.5) can be found here.
- You could replace the corda.jar file in the docker image with enterprise Corda jar, by mounting it in the following location /opt/corda/bin/corda.jar.
Update Prometheus config
We are just monitoring a single node, we do not need multiple targets in Prometheus. We need to remove multiple targets from the Prometheus configuration file, generated after following Neal’s blog.
You could also setup a similar monitoring dashboard as suggested in this blog for monitoring multiple nodes but you would need to do a little update to the metric queries used in the dashboard so that the nodename is included as a parameter in the queries. Having a single target in prometheus helps us to get rid of that.
Just replace prometheus.yml found in the path ./mynetwork/prometheus/prometheus.yml with the content below:
global:
  scrape_interval: 10s
  external_labels:
    monitor: "corda-network"
scrape_configs:
  - job_name: "node"
    static_configs:
      - targets: ["partya:8080"]
    relabel_configs:
      - source_labels: [__address__]
        regex: "([^:]+):\\d+"
        target_label: instance
Accessing Prometheus Service
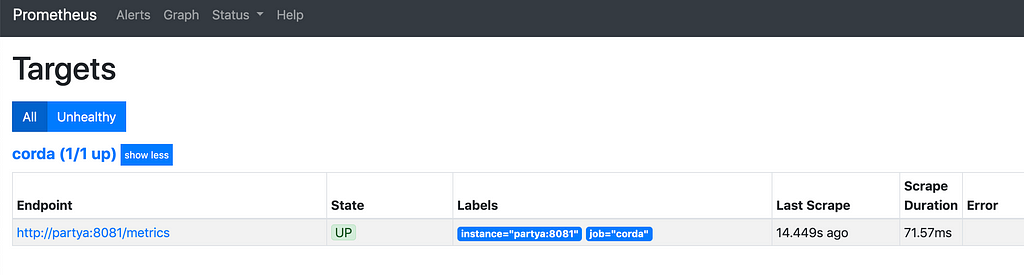
Once the containers are up and running you should be able to access Prometheus at http://localhost:9090 as configured in the docker-compose file.
Navigate to http://localhost:9090/targets to validate if Prometheus is able to connect to the Corda node. You should see something as below:
Corda nodes expose a number of metrics which are documented here: https://docs.https://corda.net/docs/corda-enterprise/4.5/node-metrics.html
We can use Prometheus to query Corda node metrics. For example, we could query the total number of flows executed by the node using the query net_corda_Flows_Count{name=”Started”} as shown below. The queries can be executed at http://localhost:9090/graph
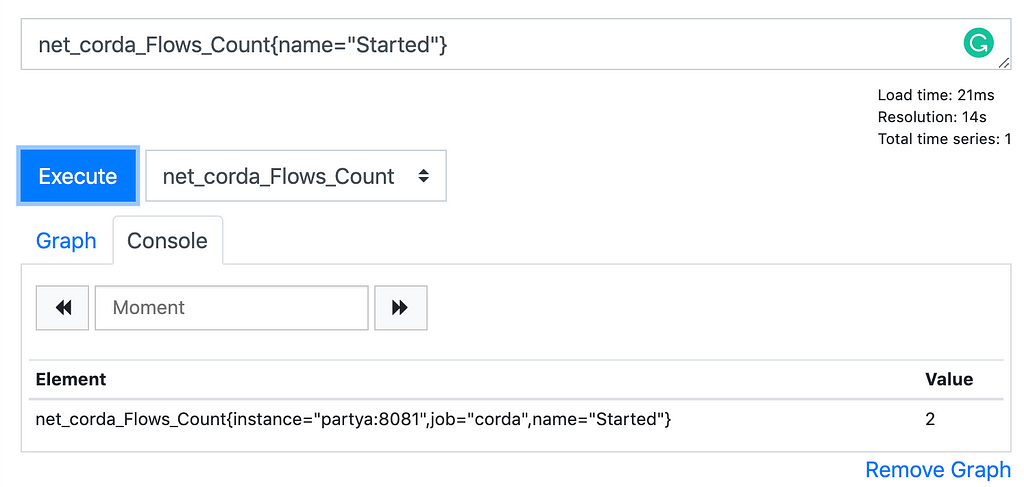
But this information is probably not very useful, we might want to draw some graphs and visualize the node metrics. Prometheus is not very good at visualization so we used Grafana.
Corda uses DropWizard to export different types of metric data like Gauges, Counters, Histograms, Meters and Times. Learn more here: https://metrics.dropwizard.io/4.1.2/manual/core.html
Grafana Dashboard
Building a Grafana dashboard can be a task in itself. No worries, I have already built one that can be found here. Just download and import the JSON to Grafana and you should be good.
Just a note on the dashboard in case you are using the community edition if Corda. You might see some widgets not displaying any data, that is simply because the community edition of Corda exposes a very limited set of metrics, and the data required by these wizards are not available. For example P2P and Cache metrics are not exposed in Corda Open Source, hence we can’t measure them.
There are a number of metrics that the node exposes, the dashboard should serve as a good reference, feel free to add/ remove or update some of the metrics as per your liking. You may want to learn a little about Prometheus queries if you wish to update the dashboard.
Once you have the dashboard imported you could see the sections.
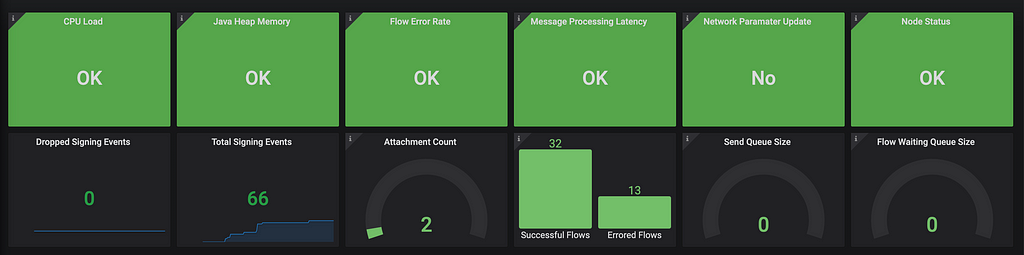
The first section displays some useful metrics. The first row shows some health information. These could also be used with a Prometheus alert manager to configure alerts. The criteria used for these has been documented here.
The second row has a number of widgets showing metrics like signing events, the number of attachments in the node, the total number of successful and errored flows, messages waiting to be sent to Artemis, and flows waiting to be executed.
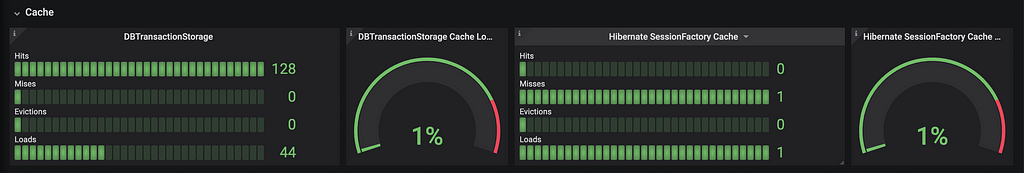
Next, we have some Cache metrics, As mentioned in the docs, Corda uses a number of caches that are categorized as weight-based and size-based cache. Below are examples of one weight-based and one size-based cache.
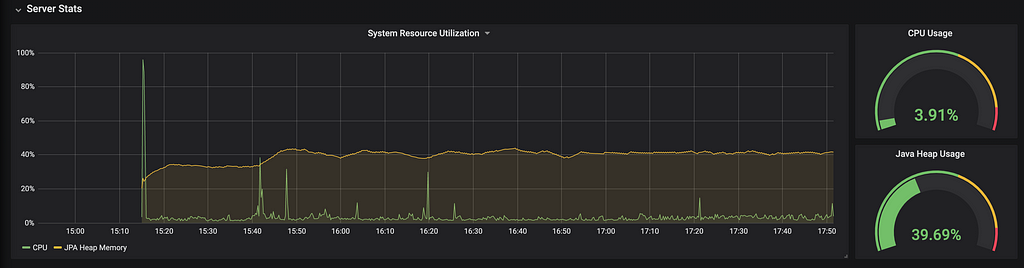
The Server Stats section shows the CPU Load and Java Heap Memory metrics.
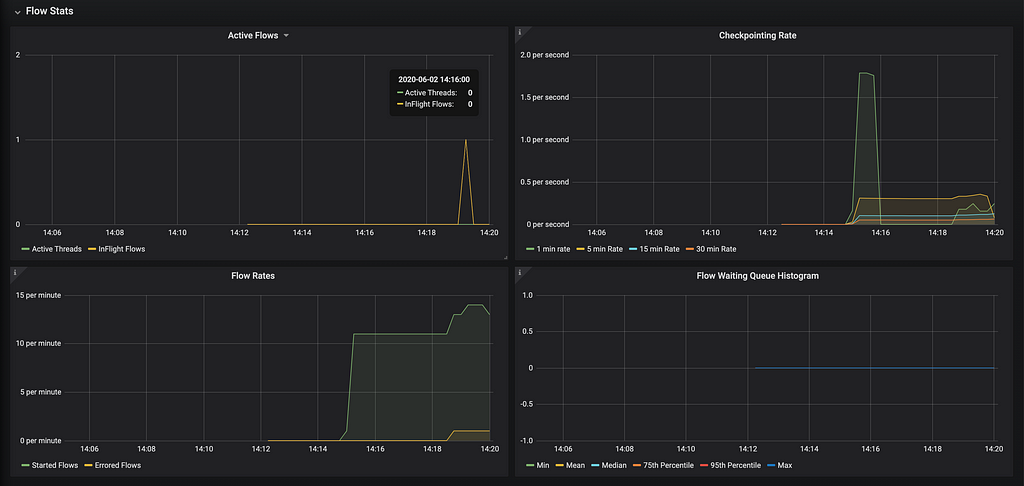
The next section shows some flow statics including the number of active flows and threads, the rate at which checkpoints events are occurring, the rate of successful and errored flows, and also a histogram showing the waiting flows.
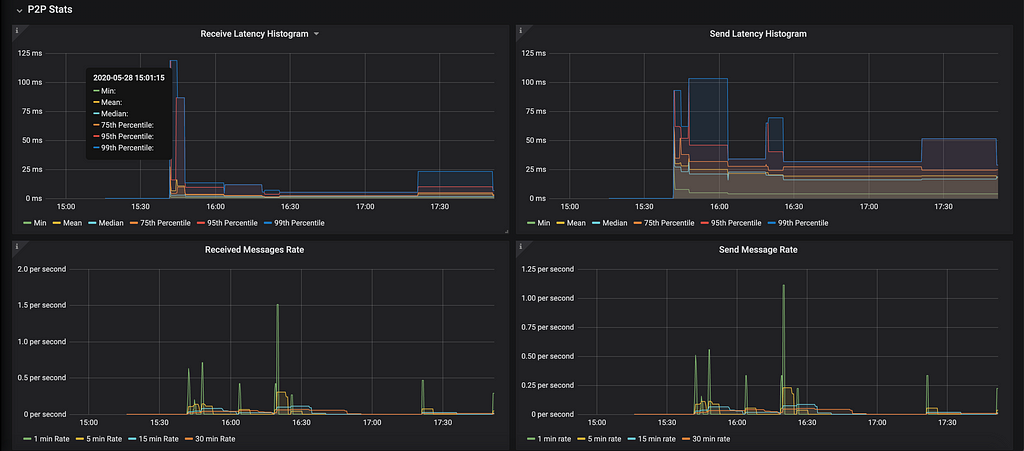
Next up, we have got some P2P metrics, showing histograms of send and receive latency as well as send and receive message rate.
And that’s it! That’s how you monitor Corda nodes using a Grafana dashboard.
Just one final point before we stop, the node also exposes certain metrics respective to each flow that is registered with the node. However, they show up only when the flows are executed at least once. These could provide some great insights into how your flows are performing. These metrics are documented here.
Thank you so much for reading.
Want to learn more about building awesome blockchain applications on Corda? Be sure to visit https://corda.net, check out our community page to learn how to connect with other Corda developers, and sign up for one of our newsletters for the latest updates.
— Ashutosh Meher is a Developer Evangelist at R3, an enterprise blockchain software firm working with a global ecosystem of more than 350 participants across multiple industries from both the private and public sectors to develop on Corda, its open-source blockchain platform, and Corda Enterprise, a commercial version of Corda for enterprise usage.
Follow Ashutosh on Twitter here.
Monitoring Corda Nodes using Prometheus and Grafana was originally published in Corda on Medium, where people are continuing the conversation by highlighting and responding to this story.